Consumer Guidance for Lowell Nordics

for & date
![]()
Lowell (Nordics), 2022
own role
![]()
Service & product designer
team
![]()
Nordic Digitalization, Lowell OY
Jens Lindeblad, Head of Digital and Innovation @ Lowell AB
deliverables
![]()
Research result reports; consumer knowledge base as multiple web pages; illustrations
challenge
![]()
How can we align the traditional contact center service to the online customer (self) service?
solution
![]()
Online consumer knowledge base
Research
DISCLAIMER: My contractual NDA prevents me from revealing some of the details of this research.
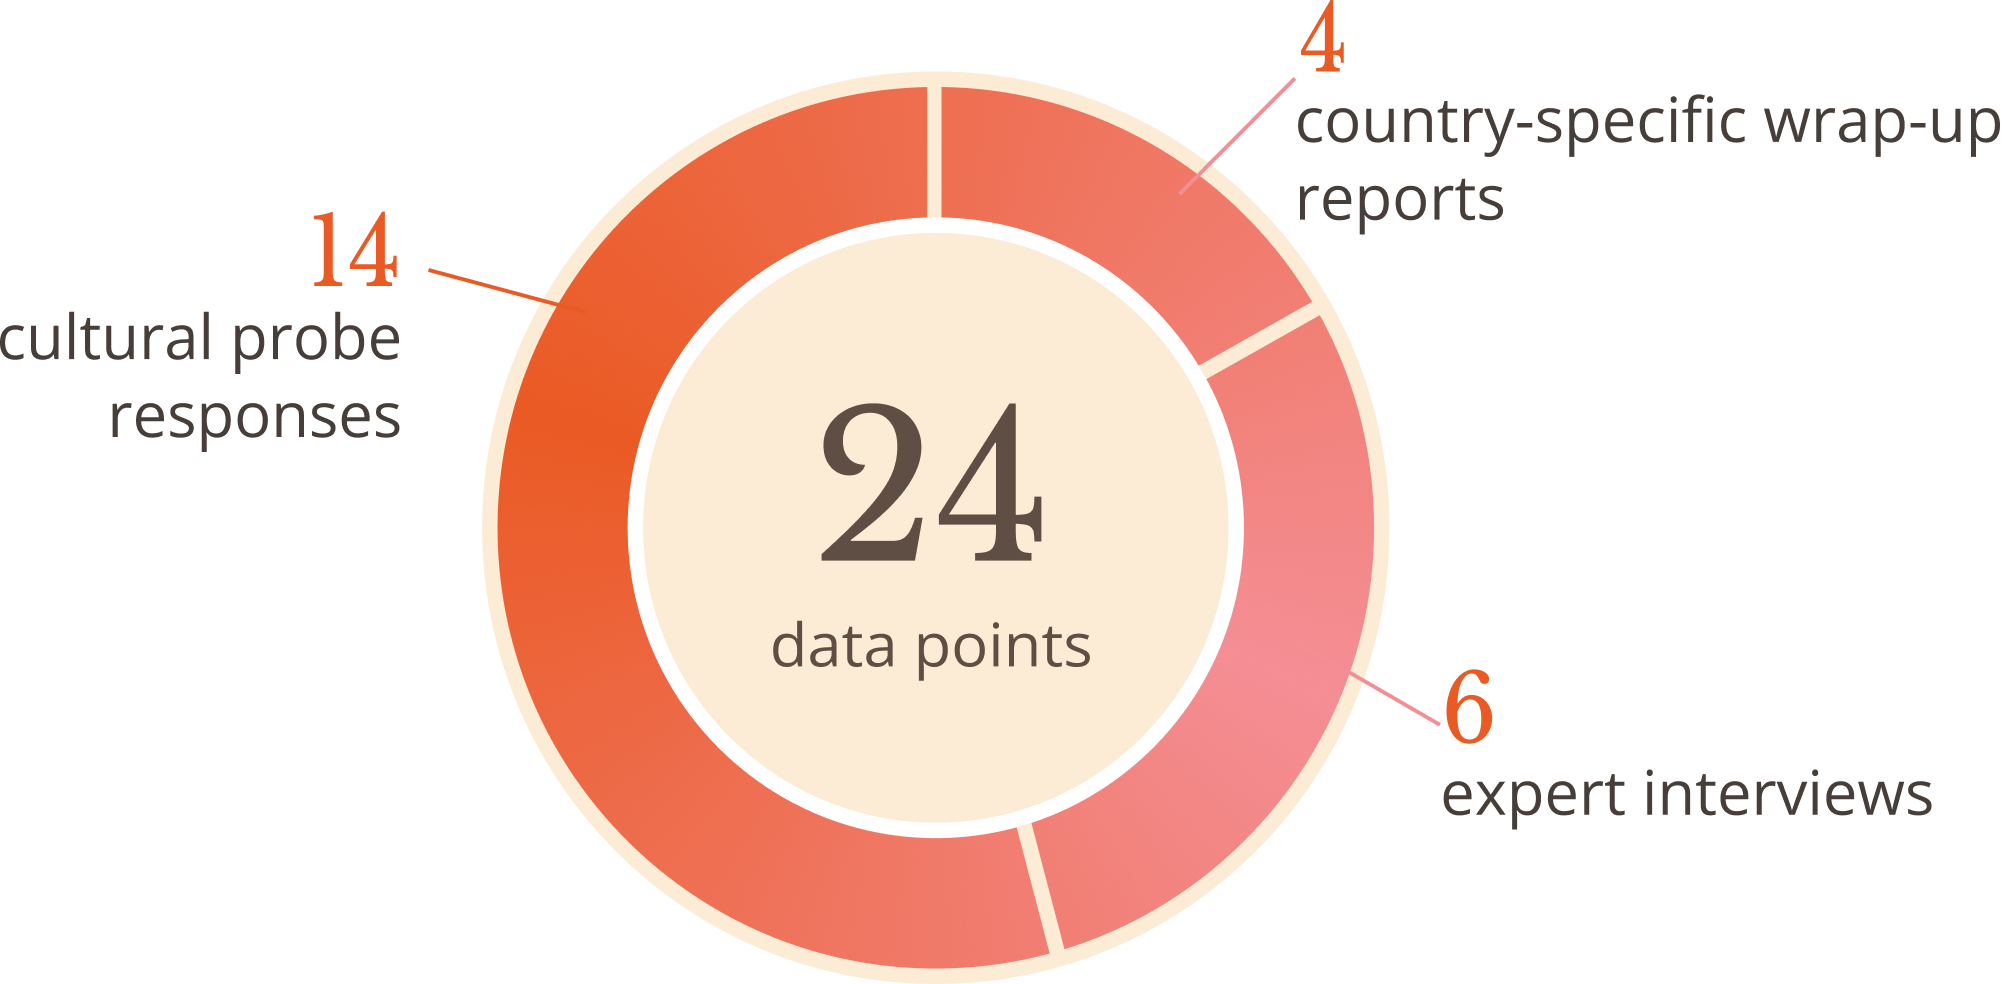
As the internal service designer, I started the research with a single preliminary survey run internally through the call center agents. In addition to that, there were 24 other data points formed through cultural probe responses, interviews with call-center team leaders and product owners, and analysis of the country-specific wrap-up codes collected through six months from Denmark, Finland, Norway, and Sweden.
Analysis
The initial analysis was coding the qualitative data collected through the cultural probes and the interviews. We found 14 common themes as a result of this analysis.
With these 14 common themes at hand, we performed a benchmark study with the wrap-up reports. This study led to eliminating some of the vaguer themes. In the end, we concluded with five main themes. Each theme represents a topic that agents (An agent is a Lowell Nordic call center employee) put in their efforts. This analysis also helped us understand better how much effort an agent puts on each domain on average.
The bar graph figure below is my attempt to describe the result as non-disclosed as possible. In this figure, each part represents one of the main themes. The figure also visualizes the average agents’ effort spent on each theme. The first part is for the theme “explanation of affairs.” As the size indicates, “explanation of affairs” is the theme which an agent puts the most of their efforts on average.

Once the coding analysis for the traditional contact center service research was complete, I began the second part of the analysis. This part involved the online customer (self) service, namely My Lowell in Denmark, Finland, Norway, and Sweden. While My Lowell is a common platform for all the mentioned countries, it often differs for each country per the country’s laws and regulations. During this second part, first, I listed all the possible functionalities within each My Lowell. After that, I used the result of our initial coding analysis as a lens to look at that functions. That provided a unique perspective for seeing the alignment between analog and digital services.

Results
The primary result of the study was the emergence of the domains where the digital services lacking over to the analog services. This contrast between the two service types provided our team with a vision for answering our original challenge. While there was a lack of coverage in all domains, we also pointed out the aspects where the digital service was superior to the traditional service. Considering these, we decided to start a project to empower our customers. With this project, our goal was to help our customers educate themselves so that they cut the need for any explanation of their affairs with Lowell.

During the time, the circumstances drove us to pilot a digital knowledge base for Lowell customers in Sweden. These customers belong to the utility market. Credit recovery in the utility market of Sweden is highly-regulated and preferably straightforward for such a project. With that knowledge, we started to map this credit recovery journey. Our mapping revealed five main steps to consider. Additionally, to tie our analog service to digital, we planned to provide links to our digital knowledge base in all our contact tools (letters, digital letters, SMSs, etc.) with Lowell customers.

Once the mapping was complete, I started to design the web pages accordingly to those five steps of collection. With each step, consumers were theoretically getting closer to the loss of their utility service. Thus, the illustrations used on those pages were reflecting the urgency of the situation while indicating the possibility of a solution. You can reach these sites from here.

Once the mapping was complete, I started to design the web pages accordingly to those five steps of collection. With each step, consumers were theoretically getting closer to the loss of their utility service. Thus, the illustrations used on those pages were reflecting the urgency of the situation while indicating the possibility of a solution. You can reach these sites from here.
